Recently, AppsFlyer, the mobile marketing cloud platform, released the 19th edition of its Advertising Platform Performance Index.
According to Sensor Tower's 2026 State of Mobile report, global in-app purchase (IAP) revenue reached $167 billion in 2025, up 10% year over year and hitting a new record, though growth slowed versus the prior year. Gaming grew more slowly at just 1.3%, while non-gaming app IAP revenue rose 21% year over year, overtaking gaming for the first time and becoming the backbone of market growth.
The expanding revenue pool also drove broad-based growth across the ad market. According to the report, 9 of the top 10 media channels posted year-over-year growth in ad spend, and 17 of the top 20 maintained growth trends. In the competitive landscape, rankings among leading channels shifted somewhat, OEM platforms generally recovered, and the advantage categories and creative formats of different platforms diverged further, creating a more differentiated competitive structure.
I. What's New in This Report and How to Read the Core Metrics
As in previous years, the report splits rankings by ad platform and list type into four categories: iOS, Android, retargeting, and creatives. Each category is further divided into gaming and non-gaming, and can be filtered by sub-category and region. iOS, Android, and retargeting lists each include both Power Rankings and Volume Rankings, while the creative lists offer Power Rankings only. Below are the criteria for each ranking; note that the data dimensions used for the Power Rankings have changed, so readers should pay close attention:
1. Volume Ranking: The non-organic installs generated by each media channel over the reporting period after fraud filtering, weighted alongside the number of apps advertised (lower weight). It directly reflects a channel's ability to drive installs.
2. Power Ranking: A weighted score combining each channel's non-fraud installs, number of apps advertised, and quarter-over-quarter change in ad spend (April last year to June this year), then adjusted by overall fraud rate. It reflects overall channel quality. The "quarter-over-quarter change in ad spend" is a new metric introduced this year, replacing the previous retention rate. This means the overall Power Rankings now place more weight on how advertisers "vote with their budgets," and because leading channels are larger, changes in their spend carry even greater weight.
3. Retargeting Index Ranking: Reflects each channel's ability to win back existing users and generate revenue. The Volume Ranking is based on total retargeting conversions, while the Power Ranking also incorporates ad spend growth rate.
4. Creative Index Ranking: Based on AppsFlyer's creative optimization product, analyzing video creatives and combining ad spend growth rate, non-fraud installs, and number of apps advertised. Rankings are provided by scenario type, including gameplay, UGC, animation, live-action, and animation plus live-action.
Note: (1) Reporting period and entry threshold: The report covers April 2025 to June 2026. To qualify, a platform must have meaningful business volume in at least 2 of the 5 major regions (North America, Latin America, Asia-Pacific, Europe, and Middle East & Africa), while covering both gaming and non-gaming. The number of ranked platforms dropped from 92 to 57 this year, most likely due to this threshold.
(2) Category definitions: The report follows Sensor Tower's classification standard, slightly different from the previous edition. Gaming: Puzzle & Lifestyle, Action & Strategy, Sports & Racing, Social Casino. Non-gaming: Media & Entertainment, Finance, Productivity, Lifestyle & Services, Shopping.
(3) Additionally, because AppsFlyer changed the Power Rankings methodology this edition, this article does not compare Power Rankings across versions; it only analyzes movements in the Volume Rankings.
* Note: For the full report and regional and sub-category rankings, please scan the QR code below or click "Read More" at the end of the article.
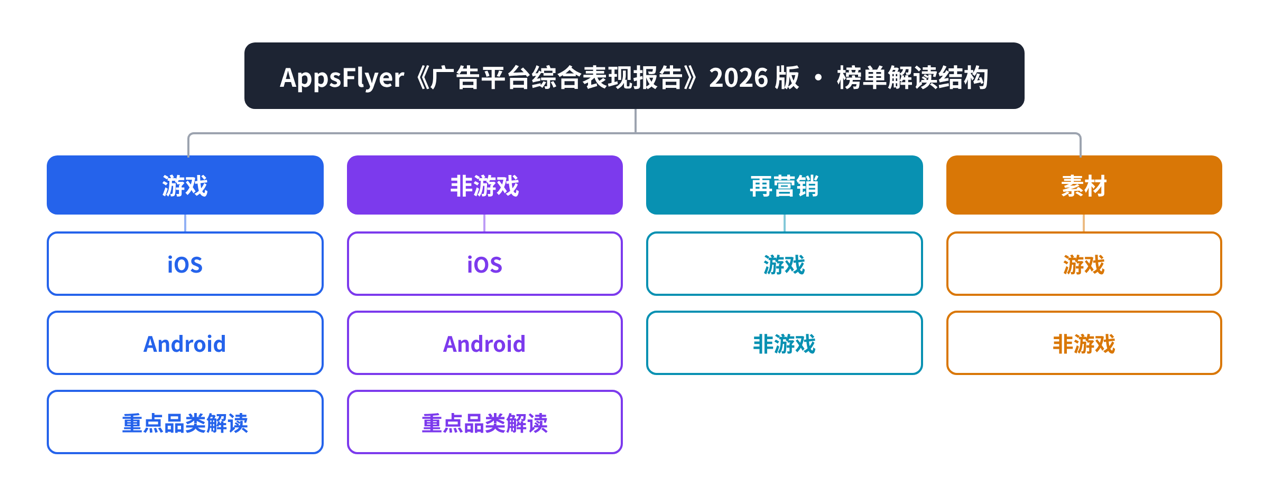
Following how vendors typically read the report, this analysis is organized into four sections: Gaming, Non-Gaming, Retargeting, and Creatives. Overview chart below:
II. Gaming
Sensor Tower data shows global mobile game IAP revenue reached $81.75 billion in 2025, up just 1.3% year over year; downloads fell 7.2% to 50.41 billion, declining for the second consecutive year. As the era of hyper-growth fades, the efficiency of user-acquisition channels has become even more critical for game publishers.
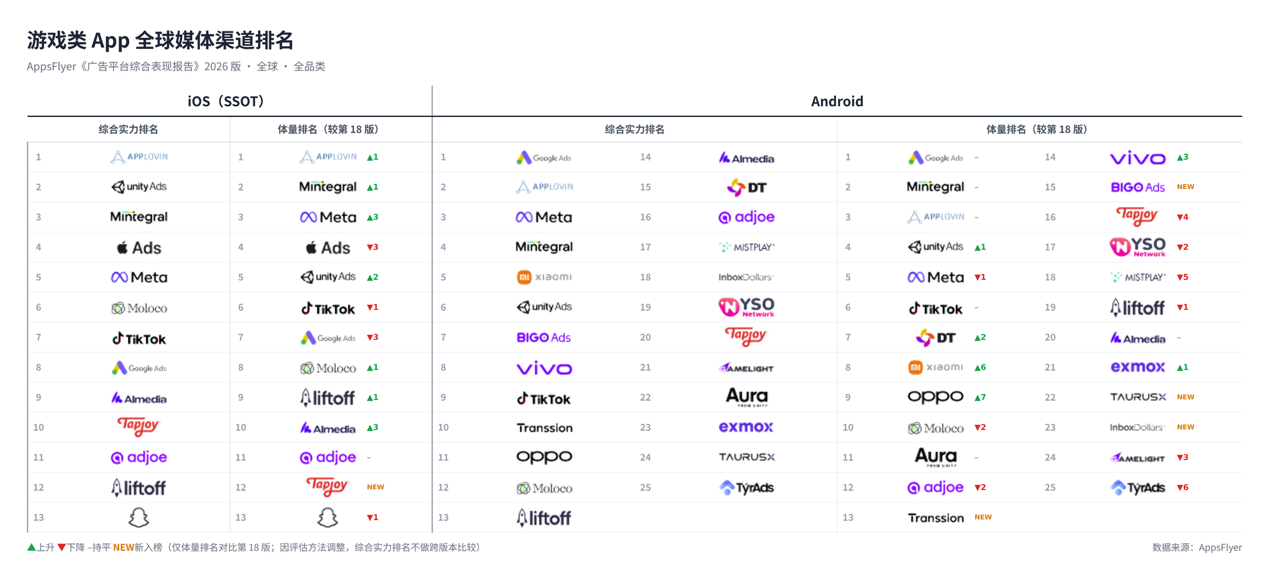
Below is the overall ranking of global media channels in gaming.
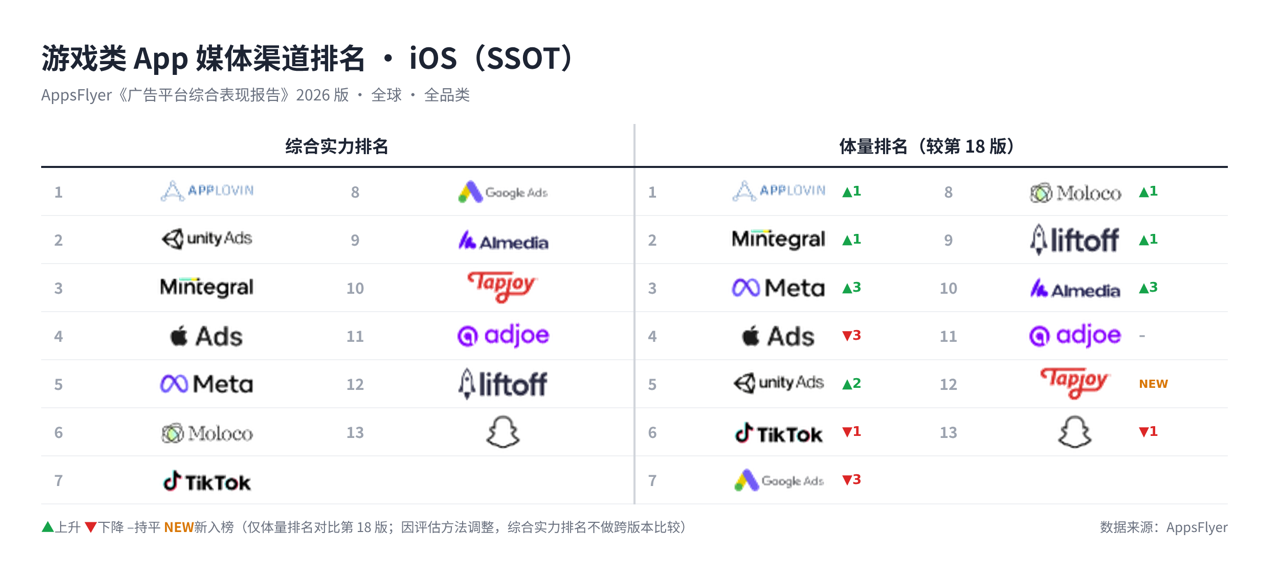
2.1 iOS: Apple Ads Slips, AppLovin Takes the Top Spot
1. Changes in the Top 5
AppLovin moved up one spot in the Volume Ranking and ranked No.1 in the Power Ranking, becoming the leader in this segment with a clear edge. The report shows AppLovin leads significantly in both Power and Volume scores, pulling well ahead of No.2 Unity Ads and Mintegral. The core reason for AppLovin's rise to the top is the "AXON engine," which uses contextual signals for ad targeting and reduces reliance on IDFA. On its Q1 2026 earnings call, AppLovin said the "AXON 2.0" engine was a key driver of business growth.
Unity Ads climbed two spots in the Volume Ranking and sits in the Top 5 on both lists. This may be related to Unity phasing out its ironSource ad platform and consolidating ad demand into Unity Ads, which is powered by the Vector AI platform.
Mintegral, under Mobvista, continued its steady climb, ranking No.3 in Power and No.2 in Volume.
2. New Entrants and Fast Risers: All Incentive Platforms
Incentive-based ad platforms maintained last year's strong momentum.
Almedia ranks No.9 in Power and rose three spots to No.10 in Volume. Its task-reward platform Freecash attracts users with cash rewards to download games and complete levels, helping game publishers acquire users.
Tapjoy, under Unity, entered the rankings this edition, landing at No.10 in Power and No.12 in Volume. Its core business is "offerwall ads," which push app installs and downstream conversions by offering rewards such as in-game virtual currency. Adjoe, the incentive platform that rose sharply last year, ranks No.11 in both Power and Volume.
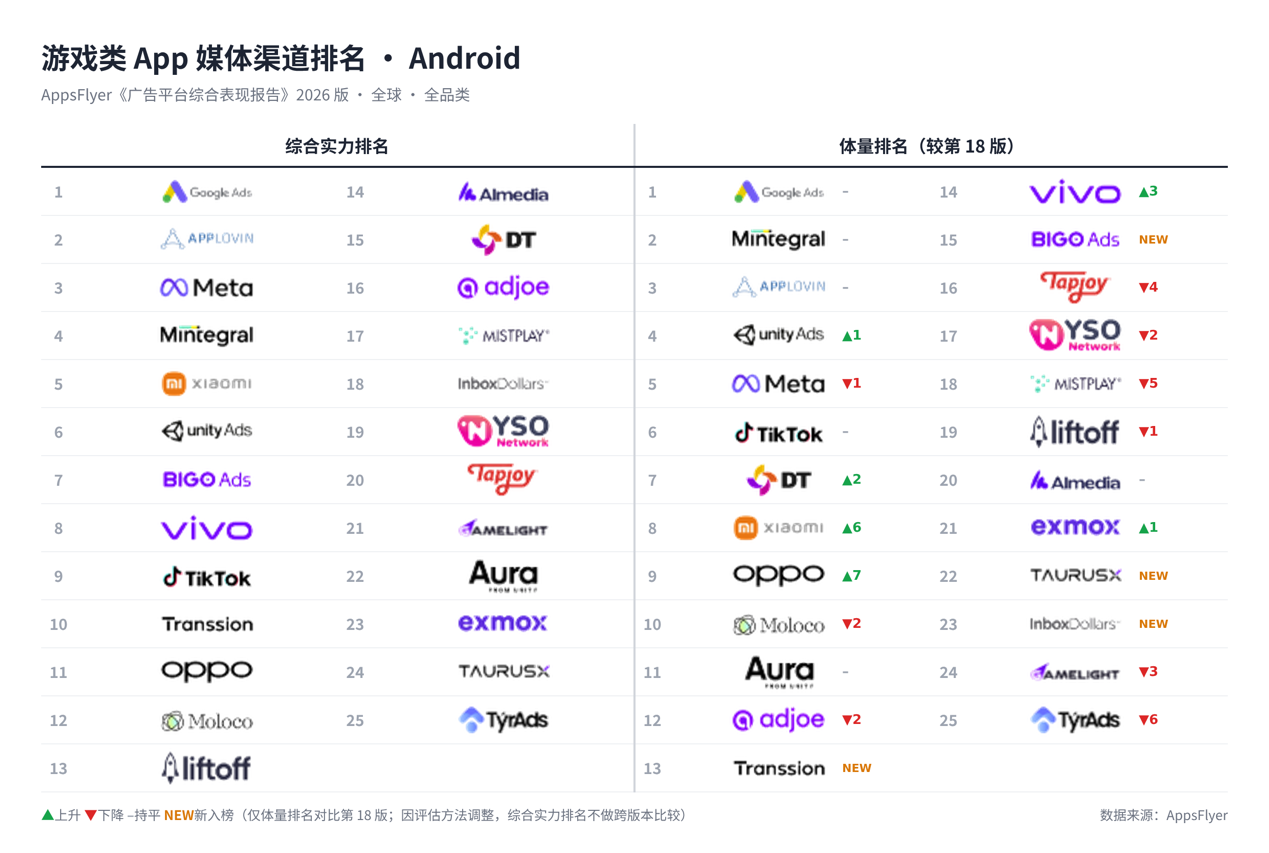
2.2 Android: Domestic Platforms Recover Across the Board, OEM Channels Shine
1. Changes in the Top 5
Unlike the accelerating divergence at the top of iOS, Google Ads remains dominant on Android, with advantages across most game categories and regional markets. Beyond Google Ads, AppLovin, Mobvista's Mintegral, and Meta Ads all stayed in the Top 5 despite slight ranking fluctuations.
This edition, Xiaomi entered the Top 5 in the Power Ranking and rose six spots to No.8 in Volume. Xiaomi's strengths are concentrated in emerging markets: it ranked No.2 in the combined-power sub-rankings for Southeast Asia, Latin America, and Africa.
2. New Entrants and Fast Risers: Domestic Vendors Deliver
Beyond Xiaomi, other domestic device-maker channels also climbed rapidly in the Volume Rankings. OPPO rose seven spots to No.9 in Volume and No.11 in Power; vivo rose three spots to No.14 in Volume and No.8 in Power; Transsion also entered the rankings this edition, at No.10 in Power and No.13 in Volume.
Among other domestic platforms, JOYY's BIGO Ads entered the rankings this edition at No.7 in combined Power and No.15 in Volume; TikTok for Business held steady at No.6 in Volume, flat year over year, and No.9 in combined Power.
2.3 Key Changes in Sub-Categories
This year the report adjusted gaming category definitions, following Sensor Tower's standard, splitting games into four categories: Puzzle & Lifestyle, Action & Strategy, Sports & Racing, and Social Casino. Below are the Top 5 platforms in each sub-category.
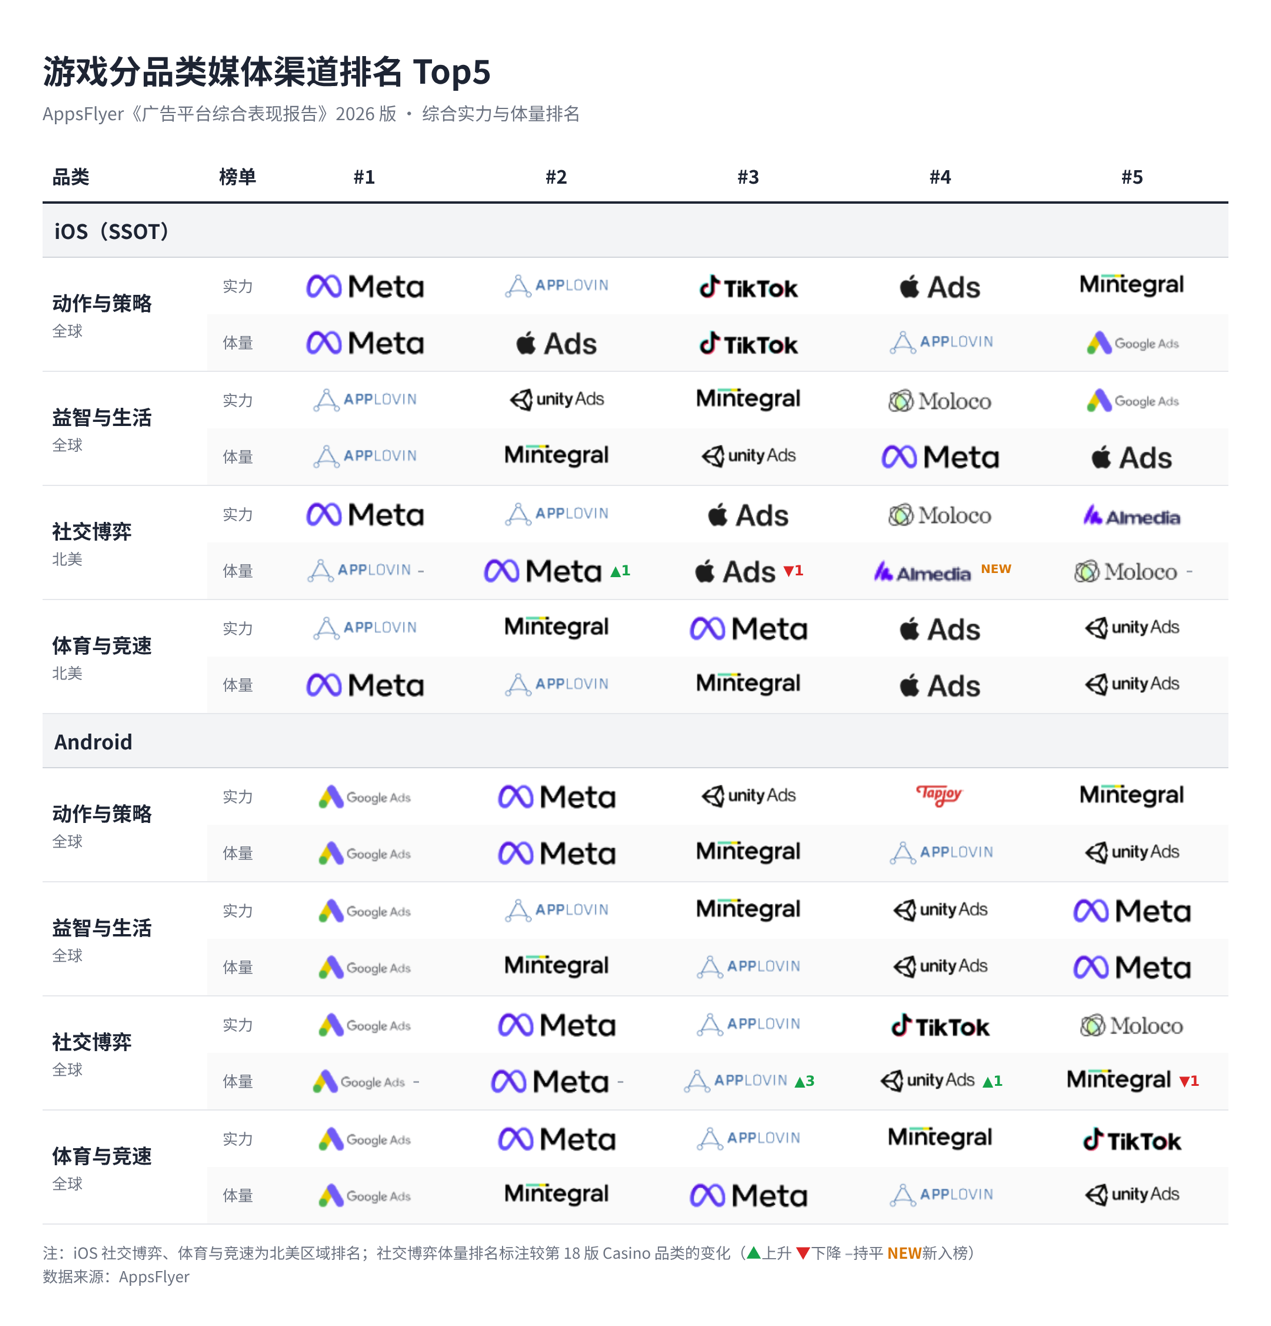
Note: On iOS, Social Casino and Sports & Racing currently show North America data only.
On iOS, channels' advantage categories have diverged clearly, with the top spot in each of the four categories split between AppLovin and Meta Ads. AppLovin leads in Puzzle & Lifestyle and Sports & Racing, while Meta Ads is stronger in Action & Strategy and Social Casino, where AppLovin ranks No.2 in both.
On Android, Google Ads swept the top spot in all four categories. Meta Ads ranks No.2 in Action & Strategy, Social Casino, and Sports & Racing, but only No.5 in Puzzle & Lifestyle. As on iOS, Mintegral's strength is concentrated in Puzzle & Lifestyle.
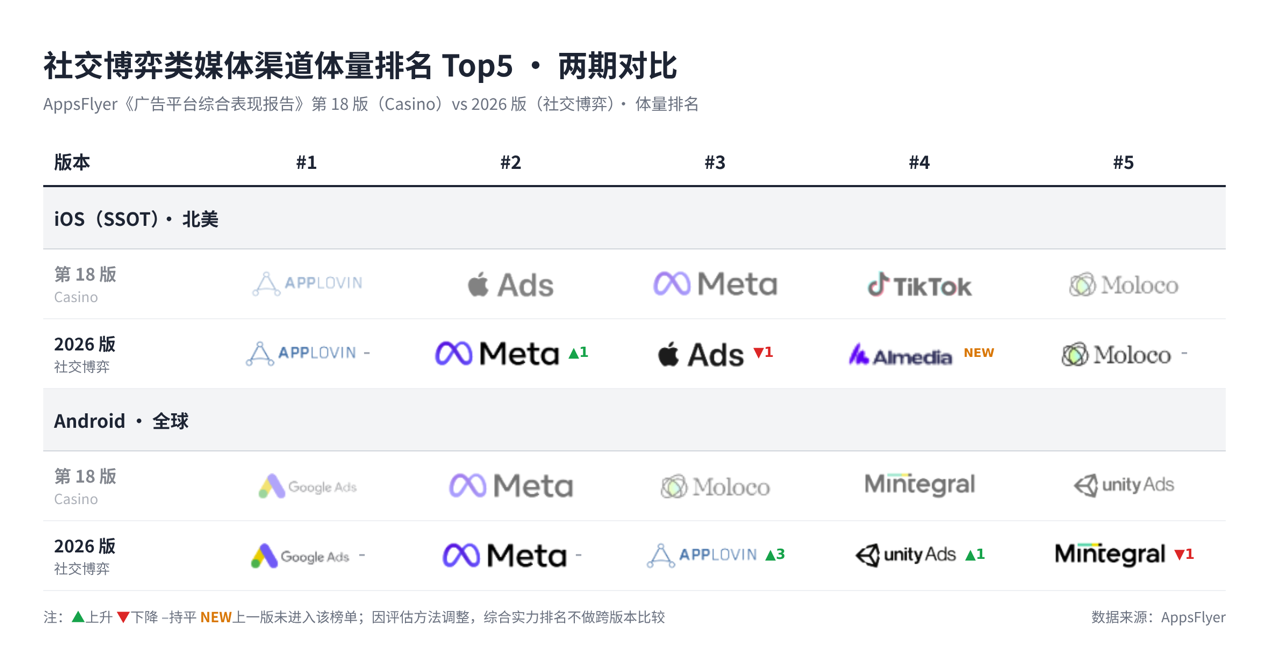
Social Casino is the only category that allows cross-period comparison. In the Volume Rankings, AppLovin has held No.1 for two consecutive years in North America on iOS, while incentive platform Almedia newly entered the top four; on Android, AppLovin rose from No.6 to No.3, while Moloco fell out of the top five.
III. Non-Gaming
Apple remains strong in non-gaming. Apple Ads tops both lists on iOS, and together with Meta Ads, Google Ads, and TikTok for Business, Apple Ads platforms occupy most of the top positions across the four lists on both platforms. Most ranking movement occurred among mid-tier platforms around 5th-10th place, where vivo, DT, and others stood out, with competition centering on sub-categories.
Below is the ranking of global media channels for non-gaming apps.
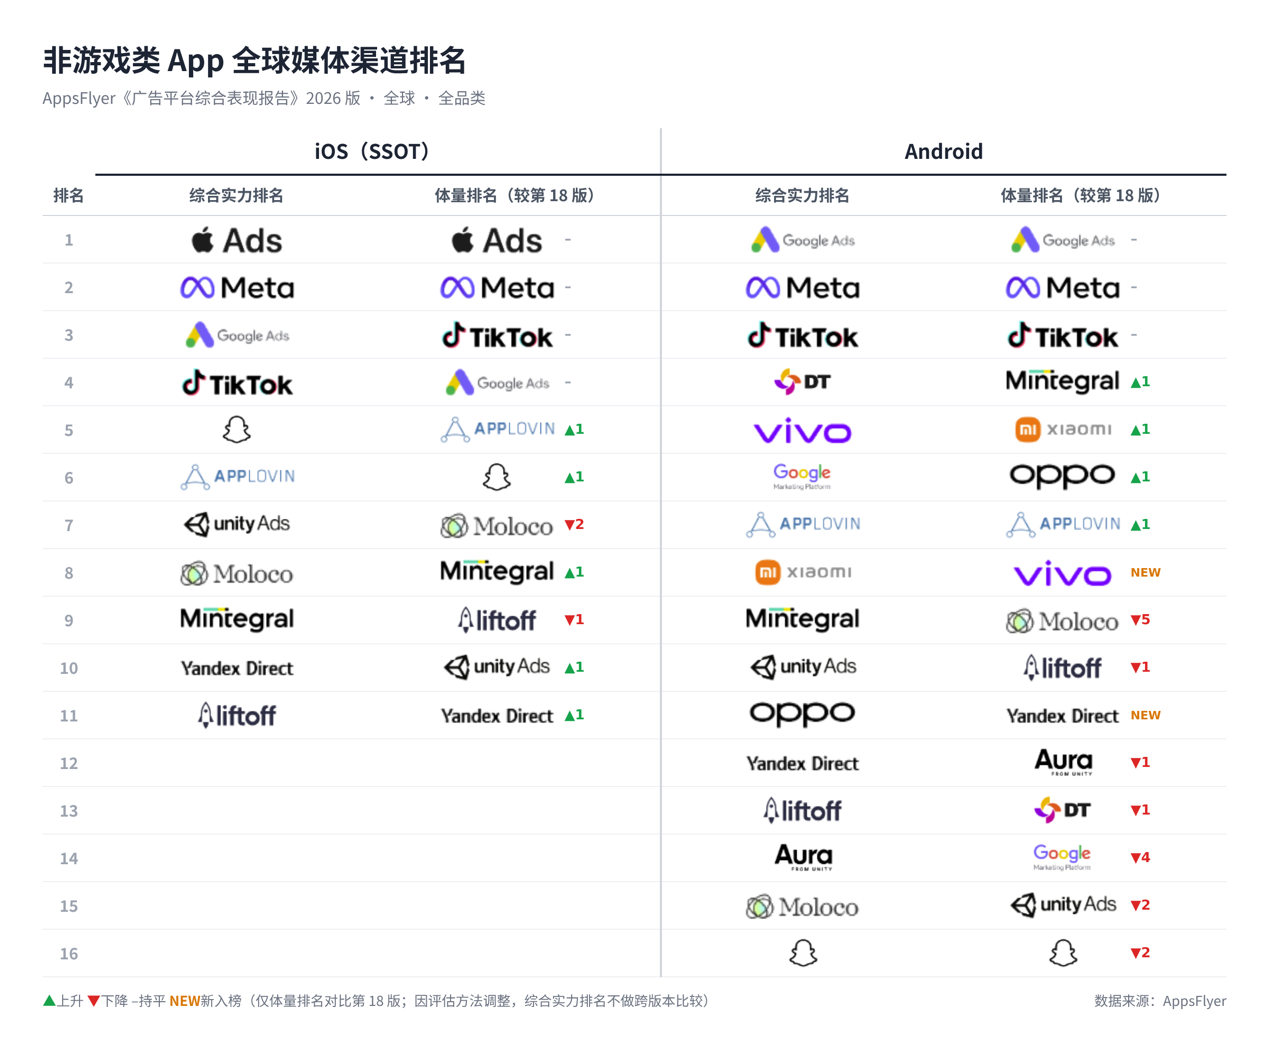
3.1 iOS: Top Platforms Stable, AppLovin Chases the Volume Top 5 in Non-Gaming
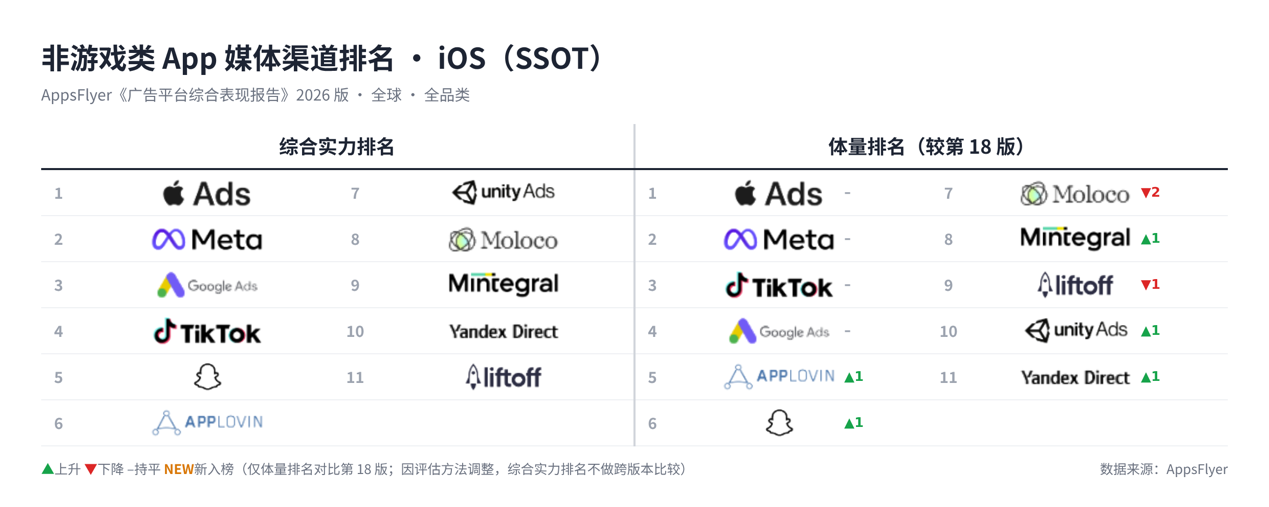
Apple Ads continues to lead iOS non-gaming, ranking No.1 in both global combined Power and Volume, with advantages in Media & Entertainment and North American finance apps. AppsFlyer attributes Apple Ads' edge to two factors: first, users arrive with clear search intent and convert better; second, users acquired through the channel in categories such as finance, shopping, and productivity have higher lifetime value (LTV), prompting advertisers to keep increasing spend.
Meta Ads ranks No.2 in global combined Power and Volume, with core markets in North America, Latin America, and Eastern Europe, and strengths in Shopping and Lifestyle & Services. Google Ads ranks No.3 in combined Power and No.4 in Volume, still lagging its Android performance, possibly due to issues with ATT privacy framework adaptation, SKAN native optimization, and conversion data return speed.
TikTok for Business ranks No.4 in Power and No.3 in Volume, with core strengths in the Middle East and Southeast Asia, as well as Media & Entertainment in North America and Western Europe. Snapchat ranks No.5 in combined Power and No.6 in Volume. The report notes Snapchat's Volume score is relatively low, and its ability to make the Power Top 5 mainly benefits from advertisers' continued increases in spend on the platform. From this angle, Snapchat is also one of the beneficiaries of the methodology changes this edition.
AppLovin deserves special mention: it ranks No.6 in Power and No.5 in Volume in iOS non-gaming, improving its Volume ranking year over year, and entered the Top 5 in multiple sub-rankings including global Productivity and North American Shopping, Finance, and Lifestyle & Services. The platform that started in gaming is successfully extending its capabilities into non-gaming.
3.2 Android: OEM Channels Rise, DT and vivo Enter the Power Top 5
1. Changes in the Top 5
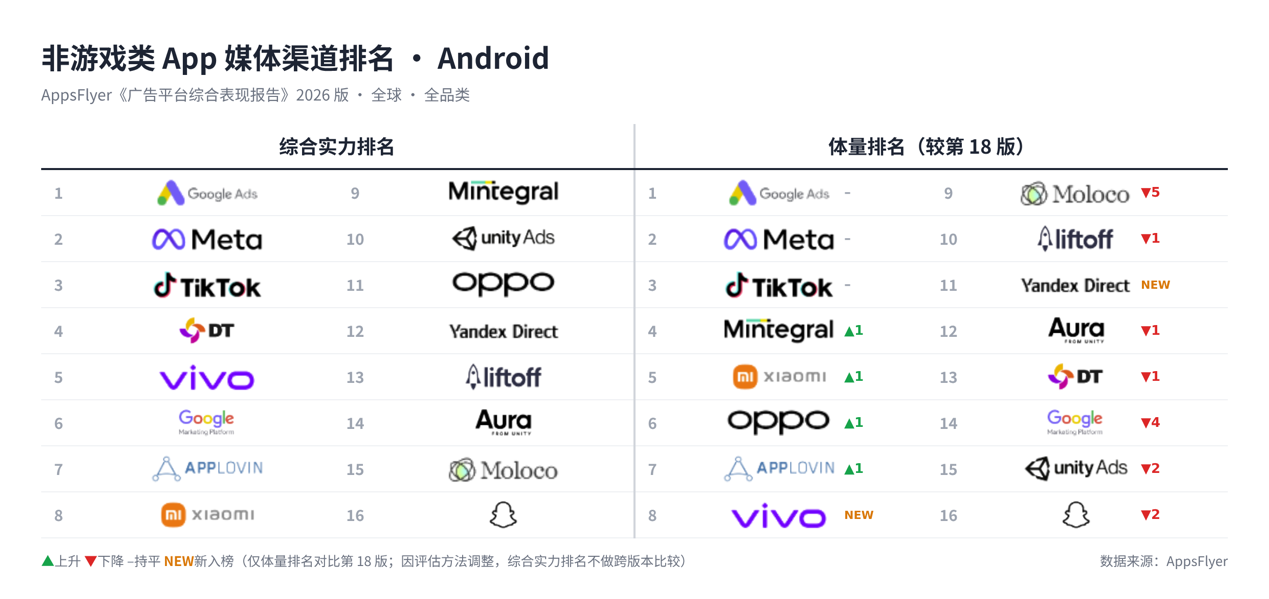
In Android non-gaming, the top three of Google Ads, Meta Ads, and TikTok for Business is fairly stable, with each having its own strengths.
Google Ads wins on breadth of coverage, ranking No.1 in most regional markets and in sub-rankings for categories such as Productivity and Lifestyle & Services; Meta Ads' strength is concentrated in Media & Entertainment apps and regional markets including Africa, South Asia, and the Middle East; TikTok for Business ranks No.3 in sub-category lists across most regional markets.
DT (Digital Turbine) also joined the Power Top 5. DT's core advantage is preloading or recommending apps at a user's first device boot through partnerships with global carriers and device makers. In daily use, DT also promotes new apps through system-level recommendation pages and notifications; it operates an in-app advertising business and uses technologies like SingleTap to reduce steps to app stores and improve install conversion. AppsFlyer reports that users acquired through preload channels perform steadily on retention, conversion, and loyalty.
2. New Entrants and Fast Risers: Domestic Platforms Rise Overall
Domestic platforms on the Android non-gaming lists trended upward overall. vivo re-entered the rankings after a year's absence, at No.5 in combined Power and No.8 in Volume; Xiaomi and OPPO also rose. Besides vivo, Russia's Yandex Direct entered both Android non-gaming lists for the first time.
On the other hand, Huawei Ads, Baidu, and Kwai for Business, which appeared in the previous edition, did not make this edition's lists.
3.3 Key Changes in Sub-Categories
Following Sensor Tower's standard, this edition divides non-gaming apps into five categories: Media & Entertainment, Finance, Productivity, Lifestyle & Services, and Shopping. Media & Entertainment is a new category this year, and short-drama apps most likely fall under it.
Below we analyze three categories: Media & Entertainment, Productivity, and Lifestyle & Services.
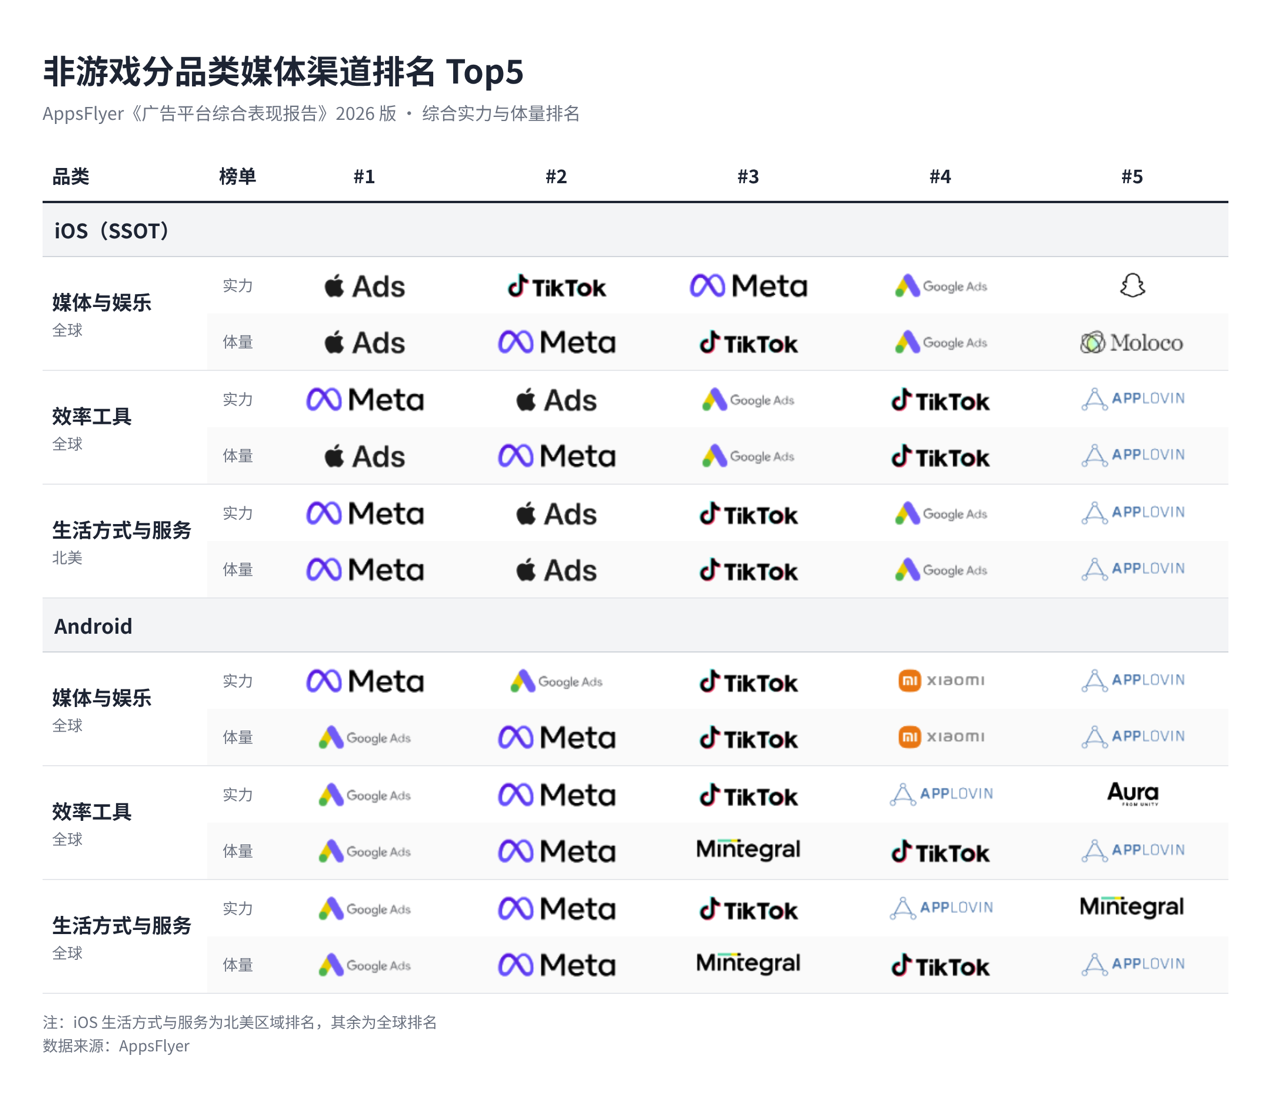
Note: On iOS, Lifestyle & Services currently shows North America data only.
In Productivity and Lifestyle & Services: On iOS, Meta Ads ranks No.1 in global Productivity and North American Lifestyle & Services combined Power, with Apple Ads at No.2; in Volume, Apple Ads tops Productivity. On Android, Google Ads and Meta Ads split the top two on both lists, with Mobvista's Mintegral No.3 in Volume in both categories.
Media & Entertainment is the category that differs most from overall non-gaming rankings. Notably, the fast-growing short-drama apps of the past two years are typically classified in this category. Here, Apple Ads ranks No.1 in both combined Power and Volume on iOS, TikTok for Business is No.2 in combined Power but No.3 in Volume, behind Meta Ads.
Additionally, Xiaomi ranks No.4 globally in both combined Power and Volume in Android Media & Entertainment, making it the only OEM platform to reach the global top five in these categories.
IV. Retargeting Index Rankings
AppsFlyer data shows global app retargeting spend reached $31.3 billion in 2025, up 37% year over year, and its share of total app marketing spend rose to 29%. Retargeting has become an essential part of app growth.
Below is the ranking of global media channels in retargeting.
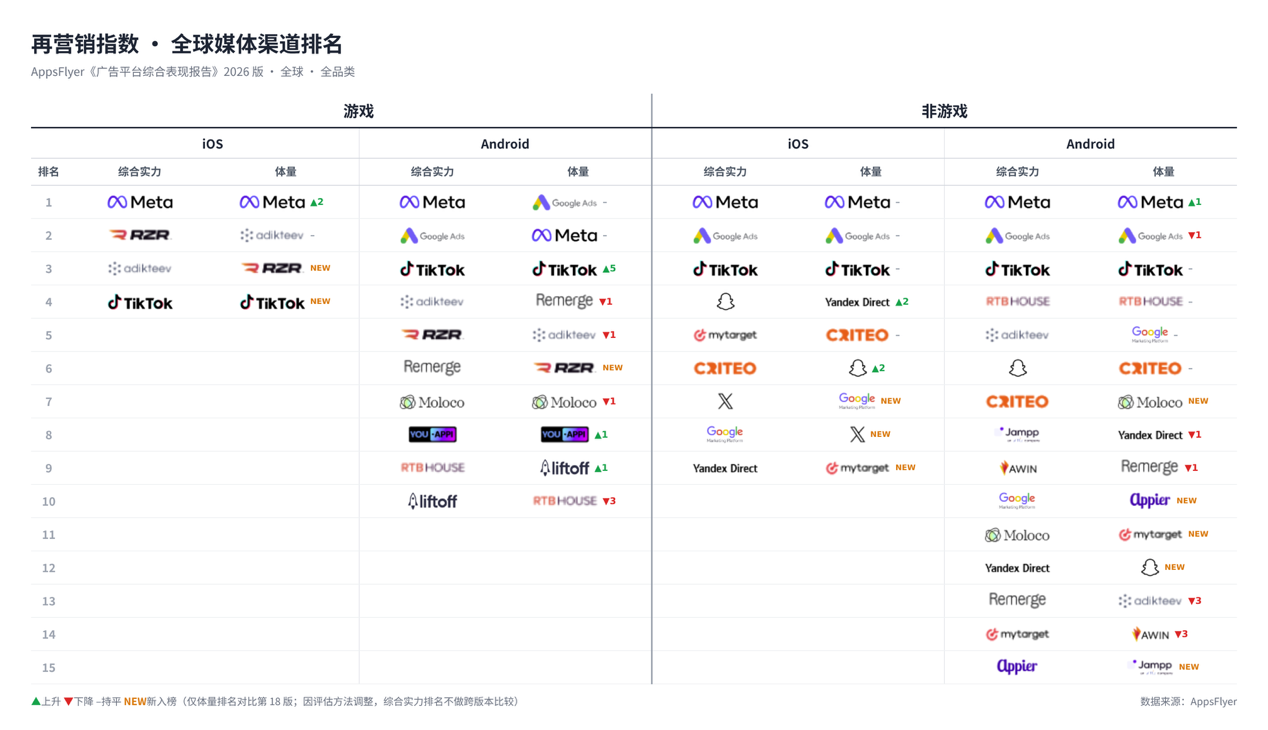
4.1 Gaming Retargeting
Due to the threshold adjustment, the number of platforms ranked on iOS fell from 6 in the previous edition to 4, and Google Ads, last edition's leader, did not appear this time. Besides Meta Ads topping both lists, RZR, Adikteev, and TikTok for Business ranked 2nd-4th across the two lists. On Android, TikTok for Business jumped from No.8 to No.3 in Volume and also ranked No.3 in Power, a notable improvement.
4.2 Non-Gaming Retargeting
In retargeting, non-gaming has a larger market and a relatively stable top structure.
On iOS, Meta Ads, Google Ads, and TikTok for Business occupy the top three on both the combined Power and Volume lists. Meta Ads, leveraging its retargeting strength in shopping apps, has combined Power and Volume scores more than double those of the No.2 platform.
The biggest change on Android is Meta Ads overtaking Google Ads to take No.1 in Volume, while also leading the Power list. After the Top 3 come dedicated retargeting platforms such as RTB House and Adikteev.
V. Creative Index
In the 18th edition last year, AppsFlyer launched the Creative Index for the first time. This edition, the methodology was adjusted along with the overall report: rankings are now calculated by creative type, combining ad spend growth rate, non-fraud installs, and number of apps, and no longer include retention performance. Creative types were expanded from last year's four categories (Animation, Animation + Live-Action, Gameplay, and UGC) to add a new Live-Action category.
Below is the combined Power ranking of global media channels by creative type. For detailed sub-category and regional rankings, please click "Read More" at the end of the article.
5.1 Gaming Creatives
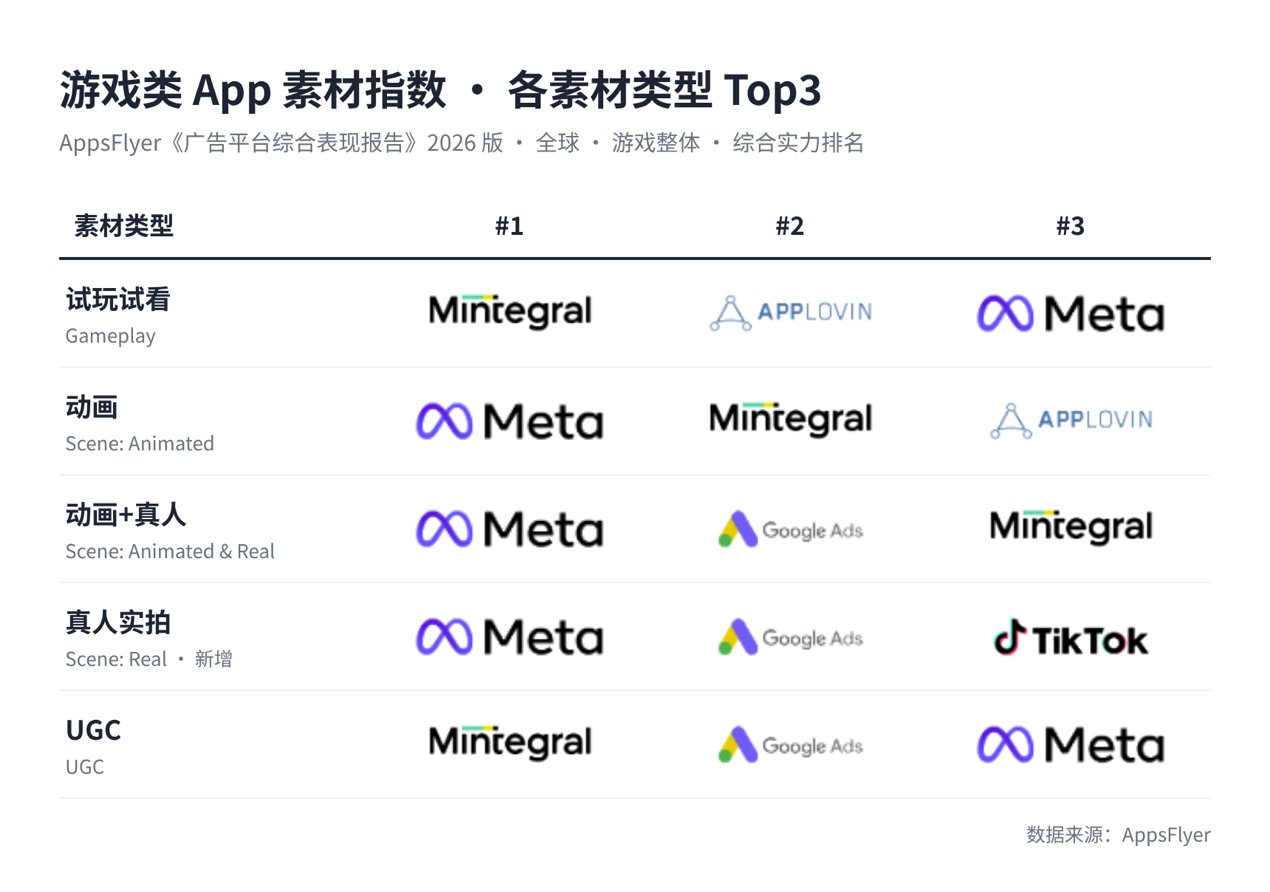
In gaming, Mobvista's Mintegral showed the most improvement, taking the top spot in Gameplay and UGC creatives, and ranking No.2 and No.3 in Animation and Animation + Live-Action respectively.
5.2 Non-Gaming Creatives
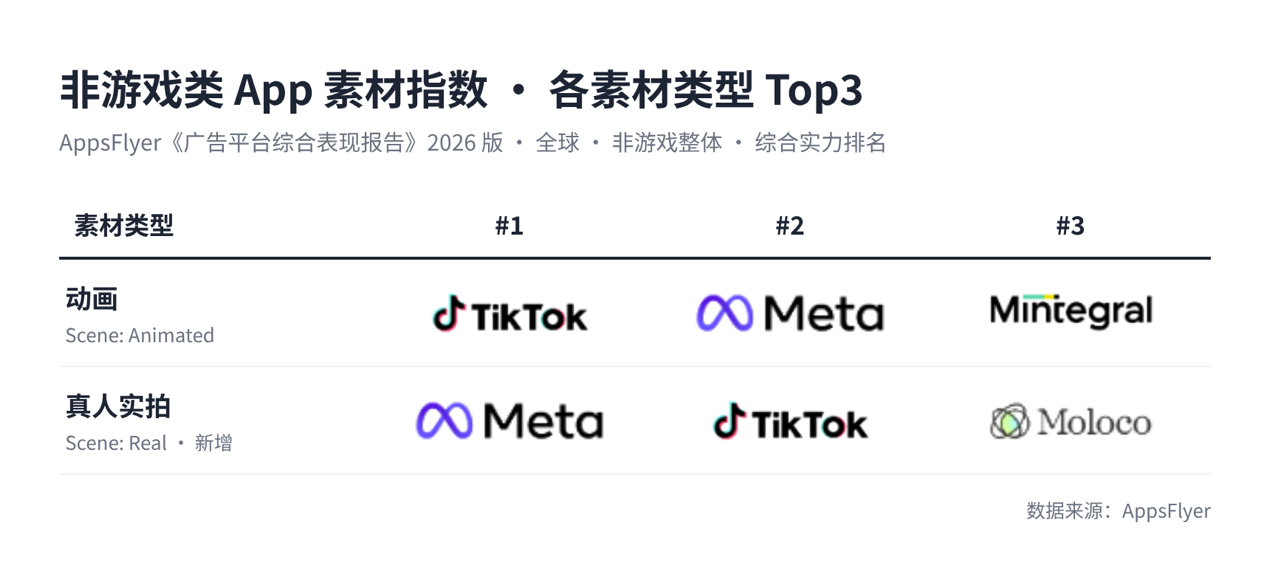
In non-gaming, the creative lists cover only Animation and Live-Action. TikTok for Business tops Animation, with Meta Ads and Mintegral at No.2 and No.3; in Live-Action, Meta Ads leads, with TikTok for Business at No.2.
VI. Final Thoughts
As a modern marketing cloud platform, AppsFlyer is committed to helping businesses turn complex data into clear insights and sustained growth. As the pioneer of a unified, measurable, and self-serve marketing paradigm, AppsFlyer aims to break down the barriers between measurement, deep linking, data collaboration, and autonomous AI workflows, helping brands achieve intelligent marketing transformation. For over a decade, AppsFlyer has been the global leader in mobile attribution, trusted by more than 15,000 enterprises.
For more details on the 19th edition of the AppsFlyer Advertising Platform Performance Index, including category and regional breakdowns, the full report, and all regional and sub-category rankings, please scan the QR code below or click "Read More" at the end of the article.